Showing posts with label Monitoring. Show all posts
Showing posts with label Monitoring. Show all posts
Oct 26, 2022
Aug 17, 2022
SQL Server's in-memory OLTP technology
Hey guys, In this blog I am going to explain you about SQL Server's in-memory OLTP technology.
Introduction-
A
native stored procedure compiler and specialized, memory-optimized relational
data management engine are both built into SQL Server as part of In-Memory
OLTP. For the most demanding OLTP workloads, Microsoft created In-Memory OLTP.
In many instances, the DURABILITY = SCHEMA ONLY option can be used to generate
memory-optimized tables in order to completely avoid logging and I/O.
The
following principles are introduced by in-memory OLTP:
- Optimized tables and indexes for in-memory
- Traditional temporary tables and non-durable tables
- Memory-optimized table type for table variables and natively built stored procedures - This can take the place of transient objects.
In-Memory
OLTP systems' effects-
- Quicker response time, greater throughput, and low latency
- High performance
- extreme performance
- An optimistic concurrency paradigm, along with improved concurrency management, can result in zero or no lock escalation management.
How is
in-memory OLTP recommended?
Consider the possible
advantages of switching to in-memory OLTP if the system meets one or more of
the following conditions.
- Applications that currently use SQL Server (or other relational databases) and need to scale up and perform better
- RDBMS with database bottlenecks, primarily related to locking/latching or code execution
Jul 21, 2022
Performance counters for disk usage
Hey guys, In this blog I am going to explain you about different performance counters and how to monitor these counters.
Performance counters
- Performance counters are bits of code that monitor,
count, or measure events in software, which allow us to see patterns from a
high-level view. They are registered with the operating system during
installation of the software, allowing anyone with the proper permissions to
view them.
Some important counters are given below,
·
Average Disk Sec/Read
·
Average Disk
Sec/Write
·
Average Disk
Queue Length
Average Disk Sec/Read - Average Disk
Sec/Read is an important performance disk counter that shows the average time
in seconds that is needed to read data from the disk. Also, it explains the
disk latency.
Both
the logical and physical disc object levels have these counters. The time it
takes to complete each read serves as the value for this counter. The speed of
the system increases with the amount of time required to read or write data. if
we get a counter value of more than 20ms, it means that our disk is not
performing well.
How to monitor Average Disk Sec/Read
Step -1: Go to start -> Performance monitor -> monitor tools -> Performance monitor -> Add counter -> Physical Disk -> Average Disk sec/Read -> Add -> Ok

Fig -1
Fig-2
Average Disk Sec/Write - Average Disk Sec/Write is also an important counter that shows the average time in seconds that is needed to
write data to disk. Also, it explains the disk latency.
Both logical and physical disc levels can keep track of this counter. The value of this counter is typically the time it takes to do each read.
The faster the system, the less time is required to read or write data.
If we constantly get a counter value of more than 20ms then it means our disk is not performing well.
How to monitor Average Disk sec/Write-
Step -1: Go to start -> Performance monitor -> monitor tools -> Performance monitor -> Add counter -> Physical Disk -> AverageDisk sec/Write -> Add -> OkFig-3Fig -4Average Disk queue length -Average Disk Queue Length counter shows us the average number of read and write requests that were
queued on the selected physical disk.
Average Disk Read Queue Length and Average Disk Write Queue Length are alternative performance disc counters to check if this
value frequently exceeds its threshold.
We may use this to determine if a high Average Disk Queue Length is the result of a high read or write operation. Less than 2 is the
suggested value for this counter for each separate disc.
How to monitor Average Disk queue lengthStep -1: Go to start -> Performance monitor -> monitor tools -> Performance monitor -> Add counter -> Physical Disk ->Average Disk queue length -> Add -> OkFig -5Fig -6


Jul 11, 2022
Memory Grants Pending
Hello there, everyone! I hope everything is going well for you. Today In this blog I am going to explain you about Memory Grants Pending and How to monitor it.
Memory
Grants Pending-
The number of processes that
are pending a workspace memory grant is known as Pending. Because they are
unable to acquire adequate RAM while awaiting a grant, queries cannot begin. A
persistent value of more than 2 can be a sign of memory pressure.
Here is a quick script which you run to identify value for
your Memory Grants Pending.

Fig.1
With the help of this query you
can easily find out the Memory Grants Pending

Fig.2
If this parameter is frequently higher than 0, your server may be under memory pressure and could benefit from more memory. Once more, this counter shows that your server may benefit from extra memory.
Jul 10, 2022
Page Life Expectancy (PLE) in SQL Server
Hey guys, In this blog I am going to explain you about Page Life Expectancy and How to monitor it.
Page Life
Expectancy (PLE)-
Page Life Expectancy (PLE) is an
age of a data page in seconds in the buffer cache or buffer memory after
querying the tables with the loading data page into the buffer memory. Page Life Expectancy value indicates the memory pressure in
allocated memory to the SQL Server instance.
To measure the Page Life Expectancy, there are two methods
Method-1: Using SQL Server Query,
With the
help of a T-SQL command, obtain PLE for your SQL Server instance-
select
* from sys.dm_os_performance_counters where counter_name like '%page life%'

Fig.1
In this case, cntr value stands
in for the PLE, which in the results of the previous query is 29570. We always
presume that the buffer memory lake is affecting query speed and that SQL
Server does not have enough buffer pool space to store the data.
Method-2: Using Performance monitor,
Monitoring Page Life Expectancy-
An important way to gauge the pressure on the buffer memory in terms of
seconds is to use the PLE counter value. Users can record it using SSMS, any
other external tools, or Microsoft Performance Monitor; it always produces an
average result. The T-SQL code above allows users to find the current value.
Still, investigation is needed in a certain time frame to determine whether
fluctuations occur at a particular point in time. By adding the PLE counter,
users can utilize the Windows Performance Monitor to track the same.
Step 1- Go to the search option in Jump Station and log in to the
server.
Step 2- Go to the SQL Server Buffer Manager in the performance
monitoring tool on the server.
Step 3- In SQL Server Buffer Manager Search Page Life expectancy and
this PLE option to the add counter.

Fig.2

Fig.3

Fig.4

Fig.5
The PLE graph is displayed here with the help
of Performance Monitoring Tools.
How to Determine the Life Expectancy of a Page-
We agree to a 300-second rule set by Microsoft. Memory pressure is particularly severe if PLE lasts shorter than 300 seconds (5 minutes), and we must take care of the performance side. However, that computation only included 4GB of memory for the SQL Server.
Conclusion-
There are numerous more buffer manager parameters in addition to PLE (Page Life Expectancy) that might impact SQL Server speed. If detected, we can assume that the primary problem is buffer memory pressure. Nowadays, larger memory boxes are prevalent, and PLE in the thousands is also relatively frequent.
Jul 8, 2022
Buffer Cache Hit Ratio
Hey guys, In this blog I am going to explain you about Buffer Cache
Hit Ratio
Buffer Cache Hit Ratio- It is
a pool of memory pages into which data pages are read. In other words, the data
pages which are read from Disk are stored in Memory (Cache) to provide data
faster. When a Data Read request is submitted, what SQL Engine does is it will
go to disk retrieve the data from disk and place it in Memory (Cache) and
return back the requested data. How
this helps? When the request to
same data pages is sent next time, there is no need to go to Disk again, it
just reads from Cache and returns the data making data retrieval faster and
there by less IO Operations. So, what are the impact when my buffer cache hit
ratio is low, how does it impact performance.
Let’s us take an example. Say that you see that the Buffer Cache hit ratio (query is below to find the buffer cache hit ratio) is around 95% when you request data. This mean 95 times out of 100 requests; SQL was able to provide data from Memory(cache) and only 5 times it had to go to Disk.
SELECT (a.cntr_value * 1.0 / b.cntr_value) * 100.0 as
BufferCacheHitRatio
FROM sys.dm_os_performance_counters a
JOIN (SELECT cntr_value, OBJECT_NAME
FROM sys.dm_os_performance_counters
WHERE counter_name = 'Buffer cache hit
ratio base'
AND OBJECT_NAME = 'SQLServer:Buffer Manager') b ON a.OBJECT_NAME = b.OBJECT_NAME
WHERE a.counter_name = 'Buffer cache hit
ratio'
AND a.OBJECT_NAME = 'SQLServer:Buffer Manager'
--BufferCacheHitRatio is between
90% to 100% then all is good.
--BufferCacheHitRatio is less
than 90% then we need to think other counters.
select * from sys.dm_os_performance_counters where
object_name like '%SQLServer:Buffer Manager%'and counter_name like '%buffer ca%'
Low
buffer cache results in High IO operations and thus leading to low performance.
Ø To measure the Buffer Cache Hit Ratio trend, there are two
methods
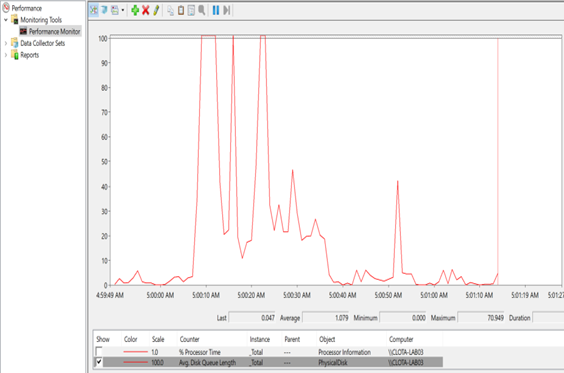
Method-1: Using Performance monitor,
Go to Search ->Type Performance monitor -> Monitoring tools ->
Performance monitor -> Add counter -> SQL Server Buffer Manager ->
Buffer cache hit ratio

Fig-1

Fig-2
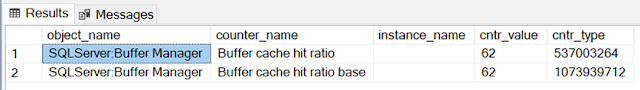
Method-2: Using SQL Server Query,
SELECT (a.cntr_value * 1.0 / b.cntr_value) * 100.0 as
BufferCacheHitRatio
FROM sys.dm_os_performance_counters a
JOIN (SELECT cntr_value, OBJECT_NAME
FROM sys.dm_os_performance_counters
WHERE counter_name = 'Buffer cache hit
ratio base'
AND OBJECT_NAME = 'SQLServer:Buffer Manager') b ON a.OBJECT_NAME = b.OBJECT_NAME
WHERE a.counter_name = 'Buffer cache hit
ratio'
AND a.OBJECT_NAME = 'SQLServer:Buffer Manager'
Jun 3, 2022
New features of SQL Server 2022
Hello guys, hope you are doing well. In this blog I'm going to discuss about the "New features of SQL Server 2022"
The release of the SQL Server 2022 is much anticipated by the
audience since the announcement of it being in the works on November 2nd, 2021.
Although the complete details of this brand-new version will be brought to
light in due time as it is currently in private preview. However, Microsoft has
already disclosed its key features that the audience should look forward to.
Although most of the product’s features are still private,
the released information has introduced some unique new performance-based
features in the SQL Server 2022. Here is a detailed list of what you’d be
working with once you get your hands on the product:

1. Performance Improvement: This feature
enables SQL Server to build better execution plans and potentially multiple
execution plans, the performance of which depends on the parameter values that
are provided at runtime.
The Query Store can now help resolve performance issues related to the
MAXDOP (maximum degree of parallelism) setting, memory grants, and the
cardinality estimator using a feedback cycle to adapt and improve query
execution plans. Finally, Query Store now supports availability group (AG)
read-only replicas.

2. High Availability and Connection Improvements: In SQL Server
2022, you may construct a distributed AG between an on-premises SQL Server and
an Azure SQL Managed Instance (MI) for use as a disaster recovery backup server
or as a read-only replica for reporting workloads, making high availability
even better. With a few clicks, you may manually failover to the MI and back to the
on-prem SQL Server.

3. Security and Governance Improvements: Using "blockchain" technologies, the new functionality creates an immutable record of data alterations throughout time. This safeguards data from tampering, which is important in some contexts and use cases, as well as providing benefits for internal and external audits. Microsoft's initial feature set has been developed into a more comprehensive data governance platform. Purview now has tighter integration with SQL Server and Azure SQL, allowing you to scan SQL Server for metadata, classify data using common classifier labels and tagging (such as PII or HIPAA data), and configure and control specific SQL Server access rights and privileges from a single Azure Purview console.

4. Query Store and Intelligent Query Processing: The SQL Server 2022 ensures that
the Query Store will be available on all new databases on the server. It
addresses the common issue in the previous models by allowing write access from
readable secondaries. This feature will enable transparency into activity on
secondary replicas. However, if a database from the older version of SQL is accessed,
the Query Store will have to be manually enabled.
5. Parameter Sensitive Plan Optimization: In older SQL Server versions, input parameters at the time of
storage had an impact on certain stored processes. Parameter Sniffing was the
popular name for this problem. One of the unique features of SQL Server 2022 is
the Parameter Sensitive Plan Optimization, which allows you to cache multiple
parameter-sensitive queries while procedures are being saved. This will assist
you avoid having to alter your code by using the recompile option or allocating
the values of the input parameter to variables within the procedure.
6. TempDB and Latch: During SQL Service Performance
Tuning in older SQL server versions, 1 out of 10 clients would struggle with
TempDB and Latch. Although you can address it in multiple ways, the practice took valuable time
and energy. The SQL Server 2022 addresses these issues by enhancements to the
TempDB database and the Memory Optimized TempDB Metadata. Experts are hopeful
that clients will not struggle with these issues with the release of this new
version.
7. Bidirectional HA/DR to Azure SQL Managed
Instance: For enhanced data backup and
security, SQL Server 2022 adds Bidirectional HA/DR to Azure SQL Managed
Instance. It allows you to connect a database to the cloud in only a few
clicks. This not only saves money, time, and labour by eliminating the
technicalities of data storage via hardware and virtual machines, but it also
encourages better backup and recovery methods. It creates an Availability Group
(AG) between a SQL Server and an on-premises Azure SQL Managed Instance.

8. Azure Synapse Link: The Azure Synapse Link helps move
data from an on-premises SQL Server to Synapse without ETL. It captures the
changes in the server and feeds them to Azure Synapse Analytics. The
Synapse link puts minimal strain on operating systems when conducting real-time
analysis and analytical processing. It fastens data transfer and increases the
connectivity of the data to other robust analytic programs.

9. SQL Server Ledger: In comparison to the competition, SQL Server has experienced fewer security concerns in the recent decade. The new SQL Server Ledger, on the other hand, secures data even further by maintaining an immutable record of any changes made to the data or stored processes. The ledger prevents unauthorized parties from tampering with or corrupting the data, lowering the chance of a security breach.
10.Multi-Write Replication: Previously, when rewritten data clashed with different clones
of the same database, the dispute had to be manually resolved. SQL Server 2022,
on the other hand, addresses this problem by adding the concept of 'last write
wins.' As a result, if a conflict between duplicates arises, the most recent
rewrite will take precedence and be copied to all copies.
--By Harigovind Gupta (Software Engineer)
Clota Technology
Subscribe to:
Posts (Atom)