May 6, 2025

Monitoring SQL Server Deadlocks using Extended Events


Extended Events were first introduced in SQL Server 2008, and therefore you will not face any problem implementing them in our environment.

Extended Events is a lightweight performance monitoring feature that enables users to collect data to monitor and troubleshoot problems.

A deadlock is a situation where two or more processes or threads are blocked indefinitely, waiting for each other to release resources that they need to proceed.

Here we are going to observe how to gather deadlock information through Extended Events :

Creating SQL Server Extended Events to Capture Deadlocks using Management Studio

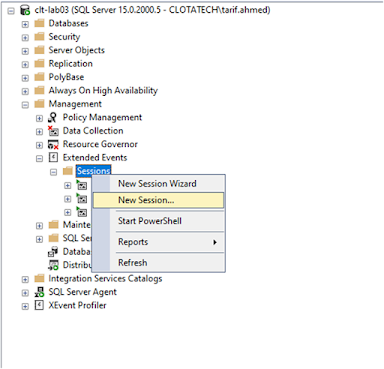
Step 1: First, open SQL Server Management Studio (SSMS) and navigate to Management > Extended Events > Sessions.


Step 2: Right-click on Sessions and select New Session.


Step 3: In the new window, provide a name for your event, we will call it SQLWATCH_deadlock in this caseSelect the event to start at the beginning of the server and when the session is created, you can change these settings if necessary.


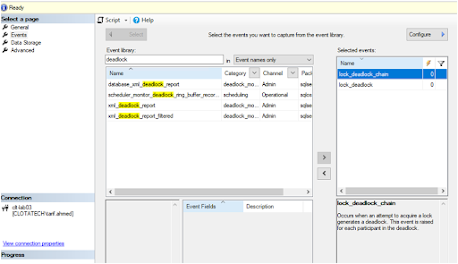
Step 4:  Go to the Events tab and in the event library textbox type “deadlock” to filter deadlock events:


Step 5: We will select 2 events: Lock_Deadlock (Raised when a request to acquire a lock is cancelled for the victim of a deadlock) and Lock_deadlock_chain (Raised when a request to acquire a lock results in a deadlock. This event is raised for all members of the deadlock).


Step 6: Having both the events chosen, click on the configure button, and a new window will be opened, in this window we will take a snapshot of the sql_text field so that we can view the query that generated the deadlock


Step 7: In the Data Storage tab, select where you want to store the Extended Event data use a file.


Step 8: After that, click on OK to save the Event configuration, we can see that the event is created and is already running.


Feb 5, 2025

The operating system returned error 59(An unexpected network error occurred.) to SQL Server during a read at offset 0x0000 in file.

Error Message

 Msg 823, Level 24, State 2, Procedure tables, Line 2 [Batch Start Line 2]

The operating system returned error 59(An unexpected network error occurred.) to SQL Server during a read 

at offset 0x00004675548000 in file '\\Server_Name\D2A_DB\MSSQL\Data\HISTORICAL_NDF_1.ndf'.

Additional messages in the SQL Server error log and operating system error log may provide more detail. 

This is a severe system-level error condition that threatens database integrity and must be corrected 

immediately. Complete a full database consistency check (DBCC CHECKDB). This error can be caused by many

factors; for more information, see SQL Server Books Online.

Cause

The Windows Session Timeout is 60 s by default. This timeout is dependent not only on Data Domain response time, 

but also any network latency. 

If there is a slow network or longer than expected Data Domain processing (such as rapid index expansion under 

a heavy backup load), Windows resets the connection causing backup errors.

PS C:\Windows\system32> get-SmbClientConfiguration

Resolution

Increase the Windows Session Timeout to a higher value such as 180 s by running the following command:

PS C:\Windows\system32> Set-SmbClientConfiguration -SessionTimeout 180 -Force

Aug 1, 2024

Mysql Replication

MySQL database servers (slave)-


I/O thread and SQL Thread-


Replication I/O threads- 

When a start slave statement is issued on a replica server, the replica creates an I/O thread, which connects to the source and asks it to send the updates recorded in its binary logs. The replication I/O thread reads the updates that the source's Binlog Dump thread sends and copies them to local files that comprise the replica's relay log.

The state of this thread is shown as Slave_IO_running in the output of show slave status.


Replication SQL threads-

The replica creates an SQL thread to read the relay log that is written by the replication I/O thread and execute the transactions contained in it.

There are three main threads for each source/replica connection. A source that has multiple replicas creates one binary log dump thread for each currently connected replica, and each replica has its own replication I/O and SQL threads.


Binary log dump thread-

The source creates a thread to send the binary log contents to a replica when the replica connects. This thread can be identified in the output of show process list on the source as the Binlog Dump thread.

The binary log dump thread acquires a lock on the source's binary log for reading each event that is to be sent to the replica. As soon as the event has been read, the lock is released, even before the event is sent to the replica.


Step 1-

Login to the database and check the global variable gtid.


Step 2-

To Check the server id and binary logfile.


Step 3-  

Open the MySQL configuration file and config.

Gtid_mode=ON

enforce_gtid_consistency=ON

server id=100

log-bin=gtidsource


Step 4 –

Restart MySQL service.


Step 5-

Now check global variable gtid, server_id and binary log.


Step 6-

Create a user in master.

Create user repl@’%’ identified by ‘Rainbow@123’


Step 7-

check global variable gtid in replica.


Step 8-

Check server_id and binary_log in replica.


Step 9-

Now check replica status.


Step 10-

Change Master to master user.


mysql> change master to  master_user='repl',master_password='Secure@321’, master_host='192.168.0.195',master_auto_position=1,get_master_public_key=1;

Query OK, 0 rows affected, 8 warnings (0.02 sec)


mysql> start replica;

Query OK, 0 rows affected (0.01 sec)


mysql> show replica status \G

*************************** 1. row ***************************

Replica_IO_State: Waiting for source to send event

Source_Host: 192.168.0.195

Source_User: repl

Source_Port: 3306

Connect_Retry: 60

Source_Log_File: gtidsource.000003

Read_Source_Log_Pos: 157

Relay_Log_File: clota-dbl06-relay-bin.000002

Relay_Log_Pos: 375

Relay_Source_Log_File: gtidsource.000003

Replica_IO_Running: Yes

Replica_SQL_Running: Yes

Replicate_Do_DB:

Replicate_Ignore_DB:

Replicate_Do_Table:

Replicate_Ignore_Table:

Replicate_Wild_Do_Table:

Replicate_Wild_Ignore_Table:

Last_Errno: 0

Last_Error:

Skip_Counter: 0

Exec_Source_Log_Pos: 157

Relay_Log_Space: 591

Until_Condition: None

Until_Log_File:

Until_Log_Pos: 0

Source_SSL_Allowed: No

Source_SSL_CA_File:

Source_SSL_CA_Path:

Source_SSL_Cert:

Source_SSL_Cipher:

Source_SSL_Key:

Seconds_Behind_Source: 0

Source_SSL_Verify_Server_Cert: No

Last_IO_Errno: 0

Last_IO_Error:

Last_SQL_Errno: 0

Last_SQL_Error:

Replicate_Ignore_Server_Ids:

Source_Server_Id: 100

Source_UUID: 25474780-4a56-11ef-b77c-000c2926dc41

Source_Info_File: mysql.slave_master_info

SQL_Delay: 0

SQL_Remaining_Delay: NULL

Replica_SQL_Running_State: Replica has read all relay log; waiting for more updates

Source_Retry_Count: 86400

Source_Bind:

Last_IO_Error_Timestamp:

Last_SQL_Error_Timestamp:

Source_SSL_Crl:

Source_SSL_Crlpath:

Retrieved_Gtid_Set:

Executed_Gtid_Set: 89ffa9fd-4a4c-11ef-8d4a-000c2995d827:1-4

Auto_Position: 1

Replicate_Rewrite_DB:

Channel_Name:

Source_TLS_Version:

Source_public_key_path:

Get_Source_public_key: 1

Network_Namespace:

1 row in set (0.00 sec)


Step 11-

After enabaling gtid.


Step 12-

Create a database and check the global variable gtid.


Step 13-

Check server_uuid.


Step 14-

Change database and check global variable gtid in replica.


Step 15-

 In replica use f1 database and check the table.