Hello there, everyone! I hope everything is going well for you. Today, I'll show you about Detach and Attach
Detach
SQL Server Database-
A SQL Server database is made
up of at least two files: a data file (mdf) and a log file (ldf), though there
may be additional data files in some circumstances. Since these files are
attached to a SQL Server instance and the file system identifies them as open,
moving them to another SQL Server instance requires more than a simple copy. Therefore,
you can disconnect the pertinent database (files) from the SQL Server instance
before relocating these files.
Detach
a SQL Server Database Using SSMS-
Step 1- To detach a database,
first right-click on it in SSMS and choose Tasks > Detach, as illustrated in
the image below.

Fig.1
Step 2- Then, you will be taken
to the following screen and click on Detach option and check the Drop
connection box, select "OK".

Fig.2
In the above screen, there are
two check boxes that you can use when detaching a database
Drop
Connections -
Before the database may detach,
there might be any active connections to the database that need to be closed.
The disconnect will not work if there are any open connections to the database.
Update
Statistics –
Before removing the database,
this will update any stale statistics. Statistics will continue to be as they
were at the time you separated the database if this option is left unchecked.
Step 3- In this case we will
select only one as drop connection options as shown below and select OK.
After the detach occurs, the Status changes to Success.

Fig.3
Step 4- The database's data and
log files will stay in the same file system location even after the database
has been disconnected and is no longer visible in SSMS's Databases list.
SQL
Server Attach Database with Log File-
After detaching the database
using either of the methods above, the mdf, ldf and ndf (if exists, these are
additional data files) need to be copied to the new location where you want to attach
the database.
Attach a SQL
Server Database Using SSMS-
Step 5- To
attach the database, right click on Databases and
select Attach... on the SQL Server instance where you want to attach
the database.

Fig.4
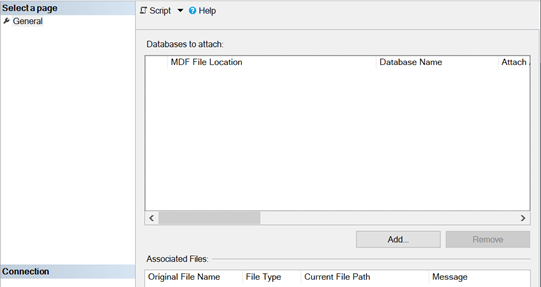
Fig.5